TLDR: Here’s a quick guide to using Excel to find your Infusionsoft open rates over time, including emails sent from the campaign builder. If you’ve had your app for a while, it’s a great exercise to see if your open rate is up or down over last year (and how it’s trending).
You hear it all the time: Email marketing is dead.
But what do you think?
Email is only dead if you’re no longer welcome in your email subscribers’ inboxes. It’s true, marketers today have a harder time standing out among the clutter of other channels and other email marketers. Still, email is very much alive, especially if you can remain relevant and welcomed in your subscribers’ inboxes. By the way, here’s a great website with stats about why email isn’t dead.
But how do you know if your messages are welcomed? Are your emails getting read more often than they were a year ago?
I’ve put together a video that will show you how to find trending open and click-through rates in Infusionsoft using an Excel pivot table. That may sound complicated, but it really isn’t. Just follow the instructions in the video and you’ll see whether or not your emails are getting opened (and clicked) more or less often than they used to. This data is so crucial when deciding on how often to send email and what your subject lines should be.
Here’s what the final graph will look like:
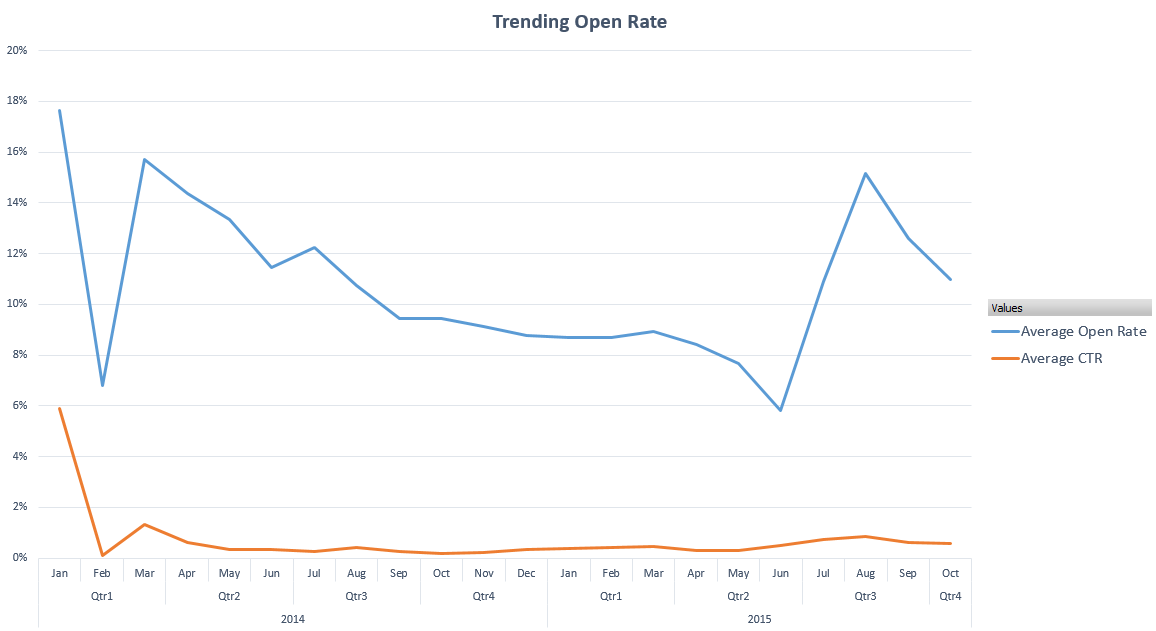
Watch the video below, follow along and let me know how your open rates stack up in the comments below.
Disclaimer: Due to the way the data is manipulated, this won’t be 100% exact because it’s averaging each month, but it will get you very close and will give you enough to make informed decisions.
If you want other visual data in Infusionsoft, check out my good friends over at Graphly.io.

